JULY 2023: It is still a seller’s market in Evergreen and surrounding areas. Pretty much Denver West to the Mountains is still a desirable and hot market still. Still multiple offers and buyer demand. Seller’s are still holding the market due to low inventory.
Evergreen, CO Real Estate Market Update: A Comprehensive Review
Real Estate Evergreen Colorado
Evergreen, Colorado, a charming town nestled in the Rocky Mountains’ foothills, is currently witnessing a dynamic shift in its real estate market. This comprehensive review provides an in-depth analysis of the current real estate market in Evergreen, CO, based on the most recent data available.
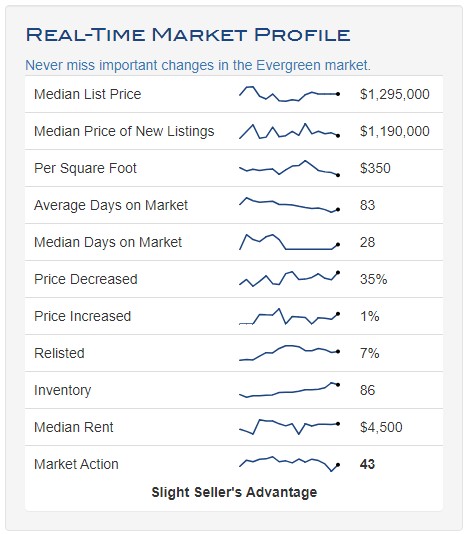
Median List Price
The Evergreen real estate market is currently characterized by a median list price of $1,295,000. This figure represents the middle point of the market, with half of the homes listed for sale priced higher and half priced lower. This median list price is a critical indicator of the overall health and direction of Evergreen’s real estate market. It reflects the current market conditions and gives potential buyers and sellers a benchmark for evaluating property prices.
Median Price of New Listings
The median price of new listings in Evergreen is slightly lower, standing at $1,190,000. This figure suggests that newer properties coming onto the market are being priced somewhat more competitively. This could be a strategic move by sellers to attract buyers in a market that currently leans slightly in favor of sellers.
Price Per Square Foot
When we break down the price by square footage, the average cost in Evergreen is around $350 per square foot. This figure is a useful measure for comparing property values and cost-efficiency across different properties and areas. It provides a more granular view of the market, allowing buyers to compare homes based on size and sellers to price their properties competitively.
Average and Median Days on Market
In terms of market activity, the average days on the market for properties in Evergreen is 83, with the median being significantly lower at 28 days. This discrepancy between the average and median suggests that while most homes sell relatively quickly, a few properties may remain on the market for extended periods, thereby increasing the average. This data is crucial for both buyers and sellers as it provides insight into how quickly properties are moving in the current market.
Price Decrease and Increase
The Evergreen market has seen a substantial decrease in prices recently, with 35% of properties experiencing a price drop. This trend could indicate a shift towards a buyer’s market, where supply exceeds demand, giving buyers more negotiating power. However, it’s worth noting that 1% of properties have seen a price increase, and 7% of properties have been relisted, indicating that sellers are still seeing some success in the market.
Inventory
The current inventory of properties in Evergreen stands at 86. This figure represents the total number of properties available for sale. A higher inventory level can indicate a buyer’s market, but in the context of Evergreen’s other market indicators, it seems to be more reflective of the area’s desirability and active market.
Median Rent
The median rent in Evergreen is currently $4,500, which is a critical figure for investors considering rental properties. This figure can provide insight into the area’s rental market and potential rental income. It’s also a valuable figure for renters considering moving to Evergreen, as it gives an idea of what they might expect to pay for rental properties.
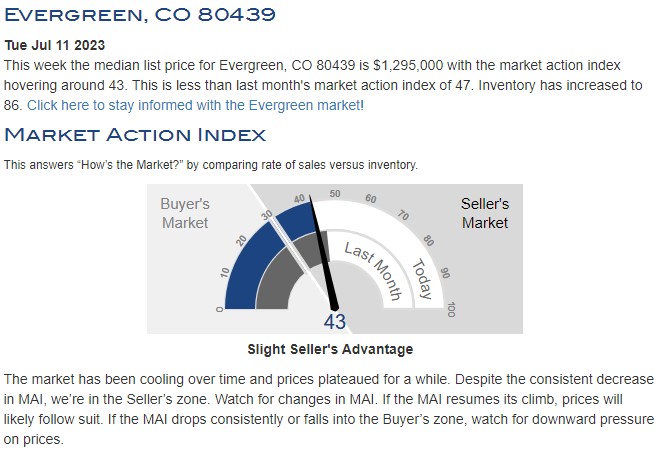
Market Action Index
Finally, the Market Action Index (MAI) for Evergreen is 43, indicating a slight seller’s advantage. The MAI measures the balance between supply and demand using a scale from 0 to 100, with 0 indicating a strong buyer’s market and 100 indicating a strong seller’s market. An MAI of 43 suggests that sellers have a slight upper hand in negotiations, but the market is relatively balanced overall.


Leave A Comment
You must be logged in to post a comment.